
Last verified: October 1, 2026. This explainer covers January–August 2026, using the Ministry of Culture, Sports and Tourism’s September 28 release. It is not a full-year total.
A headline saying foreign visitors spent ₩14 trillion in Korea is attention-grabbing. But before you turn it into a shopping budget—or assume it proves which beauty products everyone is buying—check what was actually counted.
The short answer: the official figure is ₩14.018 trillion in foreign credit-card spending, including online spending. Korea also recorded about 15.05 million foreign visitor arrivals over the same eight months. These are different measures, not a ready-made “average tourist spending” calculation. The distinction matters if you are planning a trip rather than following the tourism industry.
The verified numbers, without mixing won and people
Here are the key figures in the official September 28 tourism release. “Growth” compares January–August 2026 with January–August 2025, not with the whole previous year.

| Measure | Reported result |
|---|---|
| Foreign visitor arrivals | 15,048,435; up 21.6% |
| Foreign credit-card spending, including online | ₩14.018 trillion; up 48.5% |
| Share arriving through regional airports and seaports | 27.8% |
For August alone, the ministry reported approximately 2.25 million arrivals, up 23.3% from August 2025, and described this as a monthly record. We use the rounded figure supplied in the release rather than reproducing an unverified exact count from a social-media caption. Read the government’s policy-news summary (Korean).
China, Japan and Taiwan: those are visitor counts
The release’s country-and-region table records 4,816,134 arrivals from China, 2,698,857 from Japan, and 1,656,255 from Taiwan. Its unit is people. Those figures are not ₩4.81 trillion, ₩2.69 trillion and ₩1.65 trillion spent by those markets. Check the unit above a table before sharing a claim about which nationality spent the most. Source: release, page 2.
Three things this headline does not tell you
1. It is not a personal trip-budget benchmark
The spending table explicitly includes online consumption. The arrival table measures a different thing. The release does not establish that every card transaction belongs to one of those arrivals, nor that the card total includes every expense paid in cash or by another method.
Dividing the two totals would produce a number, but not a reliable budget for your own holiday. A week with a shared hotel room and a few food purchases is a different plan from a solo luxury trip with large shopping purchases. Start with your accommodation, transport and meals, then add a separate shopping allowance. Our cash-versus-card planning guide covers the practical payment side.
2. It does not rank products or stores
The verified release does not break this total down into sunscreen, makeup, snacks or a named retailer. A beauty-store shopping bag in a news photo is an illustration, not a category-level sales dataset. We cannot use it to conclude that most of the ₩14 trillion went to cosmetics, or that a product is worth buying.
For your own purchase, product suitability, unit price, package size and the ability to take it home are more useful than a national spending headline.

3. Faster spending growth does not establish a cause
Card spending rose faster than arrivals. That comparison alone does not prove that the same individual visitors spent more, that prices rose by the difference, or that a particular promotion caused the increase. A causal explanation would need more detailed, comparable data. Treat this as a broad tourism-and-consumption signal, not evidence for a specific shopping claim.
Turn the news into a better shopping plan—not a bigger bill
The following is an LKG planning framework, not a government rule or a claim about the average visitor. Use it before setting aside time for shopping.
- Give shopping its own ceiling. Set a maximum in won after essential trip costs are covered. Separate purchases for yourself from gifts, so a long gift list does not quietly consume the money reserved for meals or transport.
- Write a short “must buy” list. For each item, note the exact product or type, preferred size and the most you would pay. Keep an optional list separate. A promotion is only helpful if it matches something you actually wanted.
- Compare like with like. For example, a hypothetical 50 ml item at ₩20,000 costs ₩400 per ml; a 100 ml item at ₩35,000 costs ₩350 per ml. The larger pack has a lower unit price, but is still the worse purchase if you will not use it. These are invented arithmetic examples, not current store prices.
- Check the total you must pay. Read any membership, bundle or quantity conditions before relying on a displayed offer. Ask the store about refund eligibility and documentation rather than subtracting an assumed refund from your budget. Our tourist tax-refund guide explains the separate process.
- Check the trip home before buying. Consult your airline and destination’s official rules for the actual goods—especially food, liquids or large quantities. A product being sold legally in Korea does not automatically mean you can import it into your home country.
- Protect some itinerary time. Group nearby shops into one manageable stop rather than adding a cross-city journey for every recommendation. If supermarket gifts are your priority, start with our Korean supermarket shopping guide instead of treating every popular shopping district as compulsory.
A useful stopping question: Would I still buy this at its actual checkout price if there were no “tourism boom” headline, viral video or sale sign? If the answer is no, leave it on the optional list.
What the 27.8% regional-entry figure means
The ministry’s figure combines regional airports and seaports. It is an entry-route measure—not a claim that 27.8% of visitors arrived through regional airports alone, stayed entirely outside Seoul, or followed a particular itinerary. The policy-news summary identifies both airports and ports.
For travelers, the practical question is whether entering nearer your main destination simplifies your route. Compare the complete journey: flight availability, ground transport, luggage, onward travel and the cost of returning to your departure airport. A national percentage cannot decide that for you. If you are still choosing your route, our Seoul, Busan and Jeju trip-length guide is a better starting point.
Sources, method and limits
- Ministry of Culture, Sports and Tourism: September 28, 2026 press release. We checked the attached five-page PDF: page 2 for exact arrival counts; page 5 for spending units, the online-spending note and entry routes.
- Korea Policy Briefing: official September 28 summary. Cross-check for period, growth rates and rounded August arrivals.
Reading note: the PDF reports spending in 억 원, units of ₩100 million. Its total of 140,180 units equals ₩14.018 trillion. Rounded monthly or regional figures may not sum exactly to the published total. We have not independently audited the underlying transaction records; this article verifies the published release and its labels, not the full dataset’s methodology.
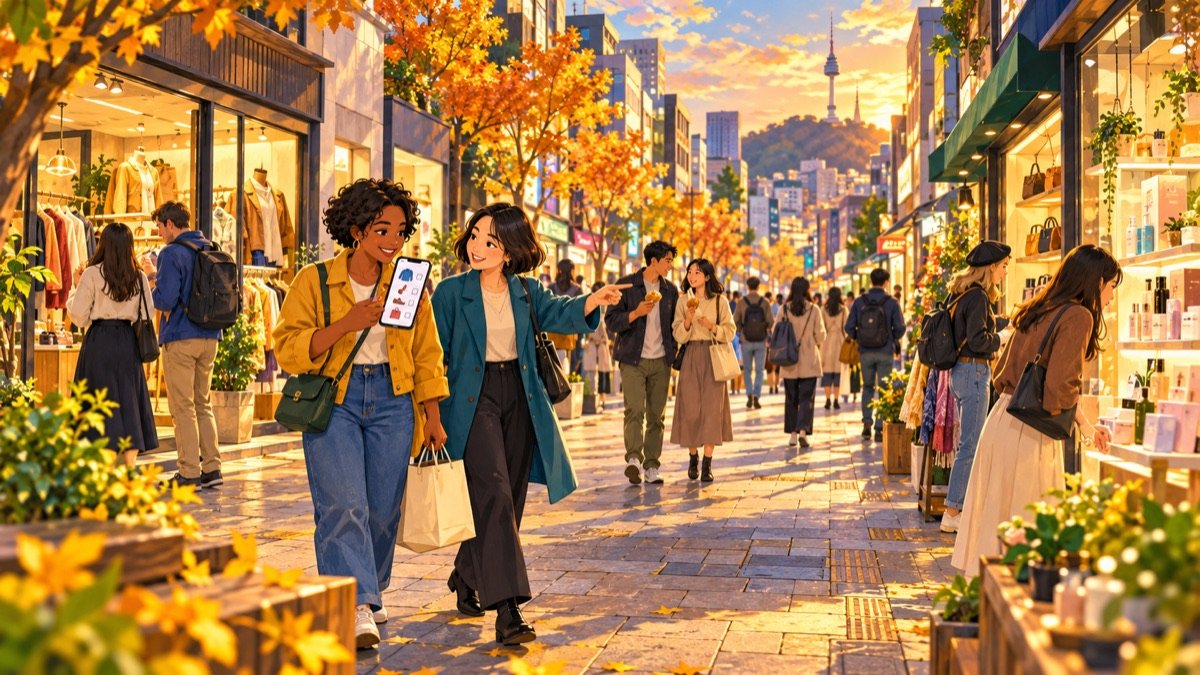
Verified on October 1, 2026. The shopping checklist is our editorial interpretation, not a firsthand shopping report. The header is an AI-assisted LKG illustration of an imagined Seoul shopping scene, not a photograph or evidence of actual visitor behavior. No third-party news photograph is reproduced.
What would you actually shop for on a Korea trip? Tell us the one product or type of gift you are trying to choose. Specific questions help us make the next shopping guide more useful.